How jemalloc cut our production memory by 47%
A FastAPI service sat pinned at its 1 GiB memory cap. The cause was glibc fragmentation under bursty async load; swapping the allocator to jemalloc cut average production RSS by 47%.
Refine's proofreading API spent most of April 2026 pinned against its 1 GiB memory cap. The cause was not a leak in our code. It was glibc's allocator retaining freed memory under a bursty asynchronous workload, and the fix was to swap the allocator to jemalloc. This is the investigation that found it and the production result.
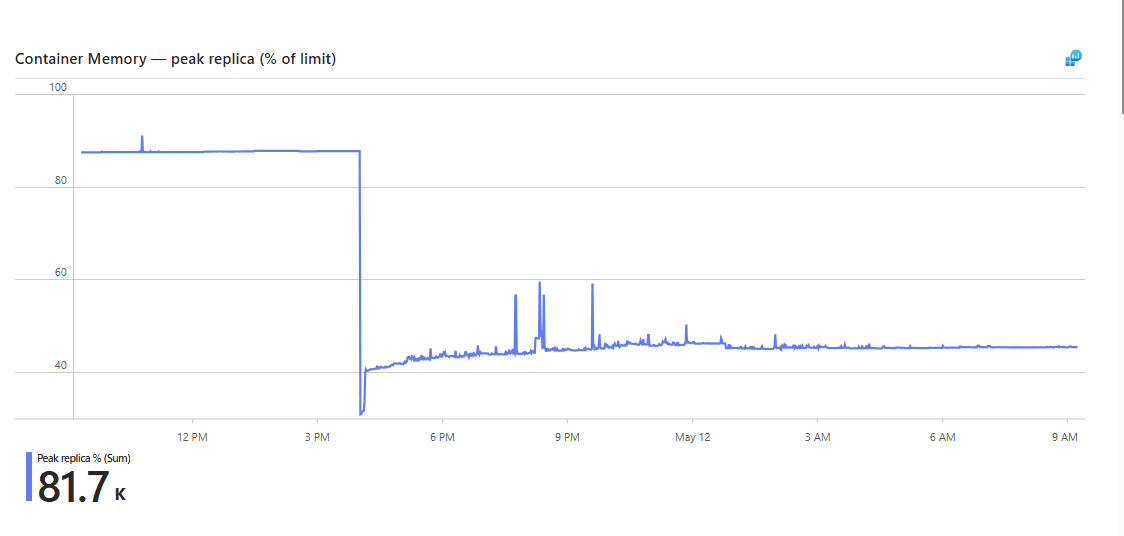
After swapping the container allocator from glibc to jemalloc. Sustained across the first overnight cycle.
Executive summary
Refine's API is a FastAPI service on a single async uvicorn worker, deployed to Azure Container Apps with replicas at 1 GiB each. For most of April 2026 its memory chart sat at the cap: peaks pinned at 1 GiB, average in the 850–1000 MiB band, the floor never dropping between bursts.
The investigation had two layers. An initial fix on April 21 — replacing a four-worker Gunicorn process with a single async uvicorn worker — cut average RSS by 620 MiB in an hour and resolved the immediate incident. It was the correct architecture, but it only divided a deeper allocator problem by four. The fragmentation returned at smaller scale within sixteen days.
The underlying cause was glibc's malloc holding freed pages after bursts of
concurrent work rather than returning them to the kernel. No malloc-tuning
environment variable closed the gap on this workload. Swapping the allocator to
jemalloc via LD_PRELOAD did: a controlled benchmark on the production image
showed a 5.7× difference in steady-state RSS between glibc and jemalloc under
identical load. In production, average RSS fell 47.5%, from 873 MB to 458 MB,
sustained across the first overnight cycle. The shipped change is a 14-line
Dockerfile diff.
The workload and the symptom
The API is a mostly-I/O workload: request validation, database and Redis reads, blob uploads, and a fan-out of long-running Server-Sent Events streams that push processing progress back to the browser.
For most of April 2026 the production memory chart showed the same shape in any 30-day window: peaks pinned at the cap, average in the 850–1000 MiB band, and a floor that never dropped between bursts. Each deploy reset RSS briefly; within a day or two it was back at 95% of the cap.
The 30-day daily aggregate, in MiB:
| Date range (2026) | Peak/day | Avg/day | Notes |
|---|---|---|---|
| 04/06 → 04/21 16:00 UTC | 1085–1100 | 957–1042 | 15 straight days at the cap |
| 04/21 17:00 UTC ↓ | 457 | 409 | −620 MiB step in one hour |
| 04/22 → 05/04 | 580–760 | 490–676 | Stable after a contributing fix |
| 05/05 → 05/06 | 957–977 | 718–844 | Climbing back to the cap |
Left unaddressed, this pattern ends in an OOMKill on the next larger-than-usual burst. Addressed incorrectly, it is masked for a few weeks and then returns. Both happened.
The first fix reduced the symptom, not the cause
The first acute incident was on 2026-04-21 at 06:28 UTC, when Front Door's origin-health alert fired:
OriginHealthPercentage = 84.44% on prod-origins (threshold: < 90%)
The diagnostic number from that morning: a /health endpoint that does nothing
but return a small Pydantic object took 36 seconds to respond. That is not
endpoint slowness. When a no-op endpoint takes that long, the kernel's CFS
scheduler is throttling the entire cgroup.
The container at the time ran gunicorn --workers 4 on a 1 GiB
budget: four full Python/FastAPI processes per replica. Each worker reached ~250 MiB after init, four of them filled the
GiB exactly, and the container lived permanently at the OOM edge. When any
single worker saturated the vCPU, CFS throttled the whole cgroup; the idle
workers could not run Python bytecode either, so /health waited 36 seconds for
its scheduling slice. Probe failures cascaded into container kills, kills
cascaded into cold-starts of all four workers competing for the same
vCPU, and CPU ramped from 4% to 97% in 60 seconds — faster than KEDA's
40–60 s reactive-scaling cycle could absorb.
The same-day fix was deliberately small: drop Gunicorn and run plain uvicorn with one async worker.
CMD ["uvicorn", "main:app", \
     "--host", "0.0.0.0", \
     "--port", "8000", \
     "--timeout-keep-alive", "5", \
     "--timeout-graceful-shutdown", "580", \
     "--access-log"]
The reasoning was straightforward. Container Apps already supervises the process, so Gunicorn's worker manager is redundant with replica restart. Async uvicorn handles concurrency through the event loop; multi-worker only helps with CPU-bound sync code or crash isolation, neither of which matched a lightweight-reads-and-streams workload.
The deploy went out at 17:00 UTC. Average RSS dropped from 1030 MiB at 16:00 to
410 MiB at 17:00 — a −620 MiB step in one hour. The 67 ContainerTerminated
events with reason='ProbeFailure' over the previous 10 days fell to single
digits within 48 hours. The Front Door alert never fired again.
This was the correct architectural change, but it was not the fix to the underlying bug. It removed a 4× multiplier on a deeper allocator problem. The single remaining worker had the same allocation behavior; it simply took longer to climb to the cap because there was 4× more headroom before the climb mattered. For sixteen days, the chart looked healthy.
The fragmentation returned at smaller scale
By 2026-05-05 the climb was back. Hourly memory data from a 30-day query showed the floor stepping up:
05/03 (Sunday)        flat at 618 MiB for 24 hours
05/05 12:00 UTC       Max jumped 731 → 901 MiB in one hour
05/05 16:00 UTC       Max hit 1024 MiB
05/05–06              plateau at the new floor for 19+ hours
The Sunday window was the most informative observation in the investigation. The system processed nothing for 24 hours and RSS did not move. The growth was not a steady-state leak; it was load-driven and not reversed by idle time.
Cross-referencing the 05-05 12:00 UTC step against the request log: in that exact
window there were four concurrent SSE subscribers on
GET /documents/{id}/process/events/{history_id}, running for 894 to 1647
seconds each. The adapter behind those connections called
client.xrange(stream_key, "-", "+") on a Redis stream and JSON-decoded
hundreds of event payloads into a list, six times concurrently. After all six
finished, the floor was 170 MiB higher and stayed there.
This is the characteristic shape of CPython + glibc allocator retention. The mechanism is worth stating carefully, because the most common prior knowledge about it points to a fix that does not apply here.
The mechanism: glibc holds freed pages
CPython's pymalloc allocates arenas through glibc malloc. When a burst of
work allocates many objects, the arenas grow to fit the peak. When the work
completes, Python frees the objects, and tracemalloc.get_traced_memory()
reports — accurately — that almost nothing is retained at the Python level.
The resident set told a different story. In a local reproduction we drove
RedisPubSubService.subscribe through fakeredis with several concurrent
subscribers, ran gc.collect() between bursts, and compared what Python
reported against /proc/self/status:
After both bursts complete + gc.collect():
  tracemalloc.get_traced_memory().current:  0.5 MB
  /proc/self/status VmRSS:                  113 MB

After explicit ctypes.CDLL(None).malloc_trim(0):
  /proc/self/status VmRSS:                  64 MB     (-49 MB)
Python accounts for 0.5 MB; the kernel reports 113 MB resident. malloc_trim(0)
forces glibc to call madvise(MADV_DONTNEED) on every fully-free page, and
49 MB is returned. That gap is the bug: the allocator holds memory that nothing
is using and that nothing has asked it to release.
No malloc-tuning environment variable closes the gap
The common recommendations for Python RSS growth are
MALLOC_TRIM_THRESHOLD_=65536 and MALLOC_ARENA_MAX=2. Dask ships the former
as a Nanny default for long-running Python workers; GitLab and Sidekiq ship the
latter. Both are standard advice for this symptom, and we tested both before
adopting either.
| Variant | Post-rest RSS | Reclaimable gap |
|---|---|---|
| no env var | 165.6 MB | +102 MB |
MALLOC_TRIM_THRESHOLD_=65536 | 165.6 MB | +102 MB |
MALLOC_TRIM_THRESHOLD_=4194304 | 165.8 MB | +102 MB |
MALLOC_ARENA_MAX=2 | 166.6 MB | +103 MB |
| All combined | 165.8 MB | +102 MB |
explicit malloc_trim(0) once | 64.1 MB | ~0 |
No environment-variable setting prevented the gap. glibc's automatic trim fires only when free space sits at the top of the arena. In a single-threaded synchronous workload — which is what the canonical references (Dask workers, Sidekiq jobs) describe — allocations and frees are roughly linear, so the top of the arena ends up free between work items and the threshold check has something to act on. In an asyncio FastAPI server with concurrent subscribers, something is almost always allocated near the top of the arena, so the check never triggers.
The Dask precedent is correct for Dask. It does not apply to this workload, and adopting it would have shipped a no-op to production.
What the synthetic tests could and could not prove
We ran four rounds of synthetic A/B before trusting any of it. The first three
each gave a different answer. Round one had tracemalloc enabled and was
contaminated by its own allocations. Round two used single-stream cycles instead
of concurrent ones and did not reproduce the production pattern at all (RSS
stayed flat across 15 cycles regardless of variant). Round three used
back-to-back bursts with no idle time, which also does not match production.
Each round exposed a methodology gap, and each gap retroactively disqualified
the previous test.
The decisive question came at the midpoint: how do you validate a fix for a pattern you cannot reliably reproduce? The honest answer was that synthetic local-process tests had a ceiling on what they could prove. The authoritative test would be a dev rollout. Downstream of that, the local tests' job narrowed to confirming that a candidate fix loaded cleanly with our dependencies and did not crash on startup.
Once Docker was available, one further test became possible: building the actual
production Dockerfile against the actual production base image (Chainguard
dhi.io/python:3.13-dev), setting LD_PRELOAD to swap allocators, and
exercising the real subscribe code path under heavier load. This produced the
first unambiguous numbers.
40 cycles, 3 concurrent streams, 6 subscribers per stream, 2500 events × 30 KB payload, 4 seconds rest between cycles, ~10 minutes per allocator run, same image:
jemalloc (dirty_decay=1000ms) | glibc baseline | |
|---|---|---|
| Baseline RSS | 72.8 MB | 61.8 MB |
| Final RSS (post-rest) | 84.4 MB | 483.0 MB |
| Net growth (40 cycles) | +11.6 MB | +421.2 MB |
| Pattern | oscillates 79–85 MB | post-burst == post-rest, never released |
glibc reproduced the production shape exactly: cycle 0 jumped from 62 to 479.6 MB and never came back down, then ratcheted +0.1 MB/cycle with discrete +1 MB step-jumps at cycles 18 and 31. Same image; only the allocator differed. That is a 5.7× ratio in steady-state RSS under identical load.
The benchmark also caught a wrong configuration before it shipped. The first
attempt used MALLOC_CONF=...,dirty_decay_ms:5000,..., drawn from the middle of
the documented range. It made jemalloc worse than glibc on this workload,
because the inter-burst gap was shorter than the decay timer, so jemalloc held
memory while deciding whether to keep it. dirty_decay_ms:1000 — GitLab's
production value — corrected it. Without the Docker test, the 5-second value
would have shipped and made the problem worse.
The fix: jemalloc via LD_PRELOAD
The shipped change is three lines in the Dockerfile:
RUN apt-get install -y --no-install-recommends libjemalloc2 ...
ENV LD_PRELOAD=/usr/lib/x86_64-linux-gnu/libjemalloc.so.2 \
    MALLOC_CONF=background_thread:true,dirty_decay_ms:1000,muzzy_decay_ms:1000
background_thread:true runs a low-priority thread that purges freed pages
periodically without blocking request handling. dirty_decay_ms:1000 waits one
second before purging, so a burst that is about to recur can reuse warm pages.
Production cutover
We deployed to dev first and watched for five days. The pattern held through 8 deploy rollovers and ~24,000 HTTP requests. Sample windows: a 12-hour overnight on a busy weekday went from 439 to 433 MiB (jemalloc reclaimed across the night); a 30-hour continuous-traffic window drifted +7 MiB total, single-MB drift per multi-hour session. Probe failures over five days: 4 total, all deploy cold-starts. Pre-jemalloc dev had drifted from 322 to 416 MiB average across the matching 5-day window.
Production cutover was on 2026-05-11 at 13:59 UTC, via the standard tag promotion pipeline, with no IaC change.
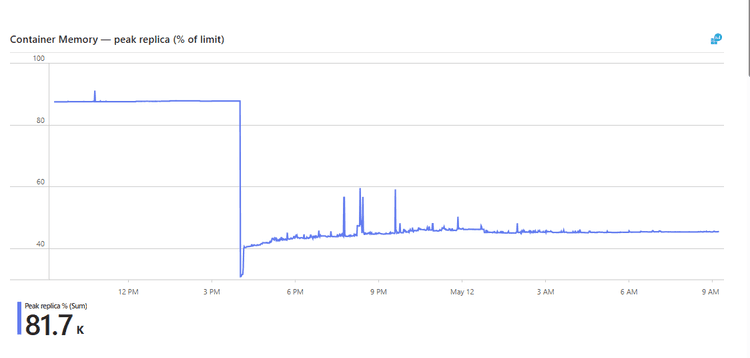
Peak-replica memory as a percentage of the 1 GiB limit, from the May 11 cutover through the following morning. The flat line at 85% is two weeks of single-worker glibc failing to return memory. The step down at 14:00 UTC is the jemalloc rollout; the new floor settles in the 40–45% band, with evening bursts that decay back to baseline rather than ratcheting it higher.
The minute-level numbers behind the step:
13:59 UTC (old revision, last 110-min sample)  AvgMB 873   ← 85% of cap
14:01 UTC (rollover minute, both revisions)    AvgMB 579
14:02 UTC (new revision only)                  AvgMB 298   ← clean floor
That is −575 MB in the first two minutes. The following 17.5 hours matched the dev prediction:
| Hour (UTC) | AvgMB | Notes |
|---|---|---|
| 17:00 | 447.8 | first busy hour, peak 580 MiB |
| 18:00 | 455.5 | peak 611 MiB (60% of cap) |
| 20:00 | 456.8 | replica restart from scale-in |
| 22:00 → 07:00 (9 hours) | 455–466 | overnight, MinMB drifted down 461 → 448 |
Before the deploy, average RSS was pinned at 873 MB, 12% headroom from the cap. After it, average RSS was stable at 458 MB overnight, 40% headroom — a 47.5% reduction in average production RSS, sustained across the first overnight cycle.
Limitations and follow-ups
- jemalloc returns memory after a burst; it does not lower the peak. The SSE
adapter still calls
client.xrange("-", "+")and loads every event into one Python list before yielding. If event payloads grow orSTREAM_TTL_SECONDSincreases, the per-replica burst peak still grows linearly with subscriber count × stream depth. A pagedXRANGE COUNT=100loop is the obvious follow-up. - The same allocator behavior likely affects our Azure Functions Python
workers. The same
LD_PRELOADbelongs there once jemalloc has more production time behind it on this service. - The synthetic tests had a ceiling. Local-process A/B runs could confirm that a candidate loaded cleanly and reproduced the shape, but the dev rollout was the authoritative test. The local numbers are directional; the dev and production measurements are the result.
Conclusion
A FastAPI service was pinned at its 1 GiB memory cap for most of April 2026. The cause was glibc retaining freed pages under bursty asynchronous load, not a leak in our code, and the common malloc-tuning environment variables did not address it. Swapping the allocator to jemalloc cut average production RSS by 47.5%, matching the 5.7× steady-state difference the controlled benchmark predicted.
Two findings generalize beyond this incident:
A correct architectural fix can hide a deeper bug for weeks. The April 21 single-worker change was the right architecture and improved the system, but it also bought enough headroom that the underlying allocator pattern stopped drawing attention. A 4× reduction in symptom intensity reads as resolution; here it was deferral, and the quiet April 22–May 4 window was the mechanism becoming more dangerous because it was less visible. The lesson is not to refuse the architectural fix, but to record the residual risk explicitly so the next responder starts with the right framing. The April 21 WIP doc is why the second investigation began at "this is allocator retention" rather than "is this a leak?".
Published precedents apply to the workloads they came from. The Dask
environment-variable default is real, well-tested, and does not help here
because our allocation pattern does not match Dask's. GitLab's
MALLOC_ARENA_MAX is real and does not move our needle either. The fix that
worked is the one the closest published case study used —
BetterUp's FastAPI memory-leak postmortem,
same stack, same symptom, same fix. Matching on workload rather than on symptom
would have suggested jemalloc earlier.
The Dockerfile diff is 14 lines. The investigation that produced it took about a week, most of it spent ruling things out — which is what the work usually is.
References
- BetterUp — chasing a memory leak in our async FastAPI service — same stack, same symptom, same fix
- GitLab —
MALLOC_CONFfor memory-constrained envs — source of ourdirty_decay_ms:1000value - glibc
mallopt(3)man page — documents auto-trim mechanics - Dask — automatically-trim-memory — the env-var precedent we considered and discarded
- Software at Scale — Run Python applications efficiently with
malloc_trim— the periodic-trim pattern, also considered, also not shipped
About the author

More posts

AI Makes Generating Analysis So Easy That Knowing What to Trust Is Now the Hard Part
AI made rigorous-looking analysis cheap to produce. A viral math claim, disproved within a day, shows why verification can't depend on the right expert happening to look at the right moment.
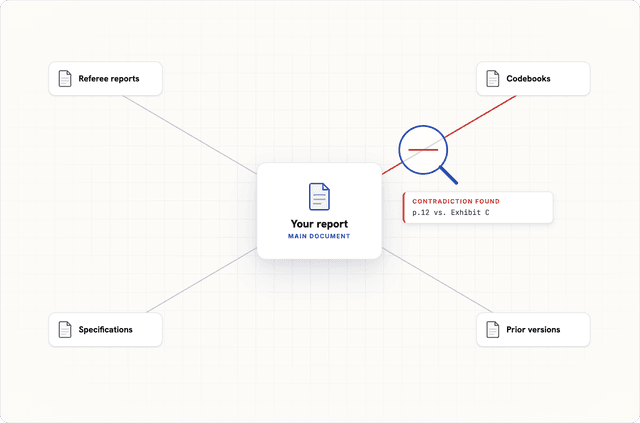
Your Document Doesn't Exist in a Vacuum. Now Your Refine Report Doesn't, Either.
With Context, attach referee reports, response letters, data outputs, and prior analyses to any Refine review — and have your document checked against everything it depends on, up to 100,000 words.

Refine has completed its SOC 2 Type 1 examination
Refine has completed its SOC 2® Type 1 examination and received its first SOC 2 report — an important step in our ongoing commitment to protecting researchers and their work.